Questions? Talk to our team on WhatsApp: +1 (213) 527-5337

Stock research for long-term investors

See what a stock is worth before you buy it.

FAST Graphs charts a company's earnings next to its share price across many years of history. When the price runs well ahead of the business, you can see it. When a good company goes on sale, you can see that too.

Opens WhatsApp. No credit card needed. Cancel anytime.1

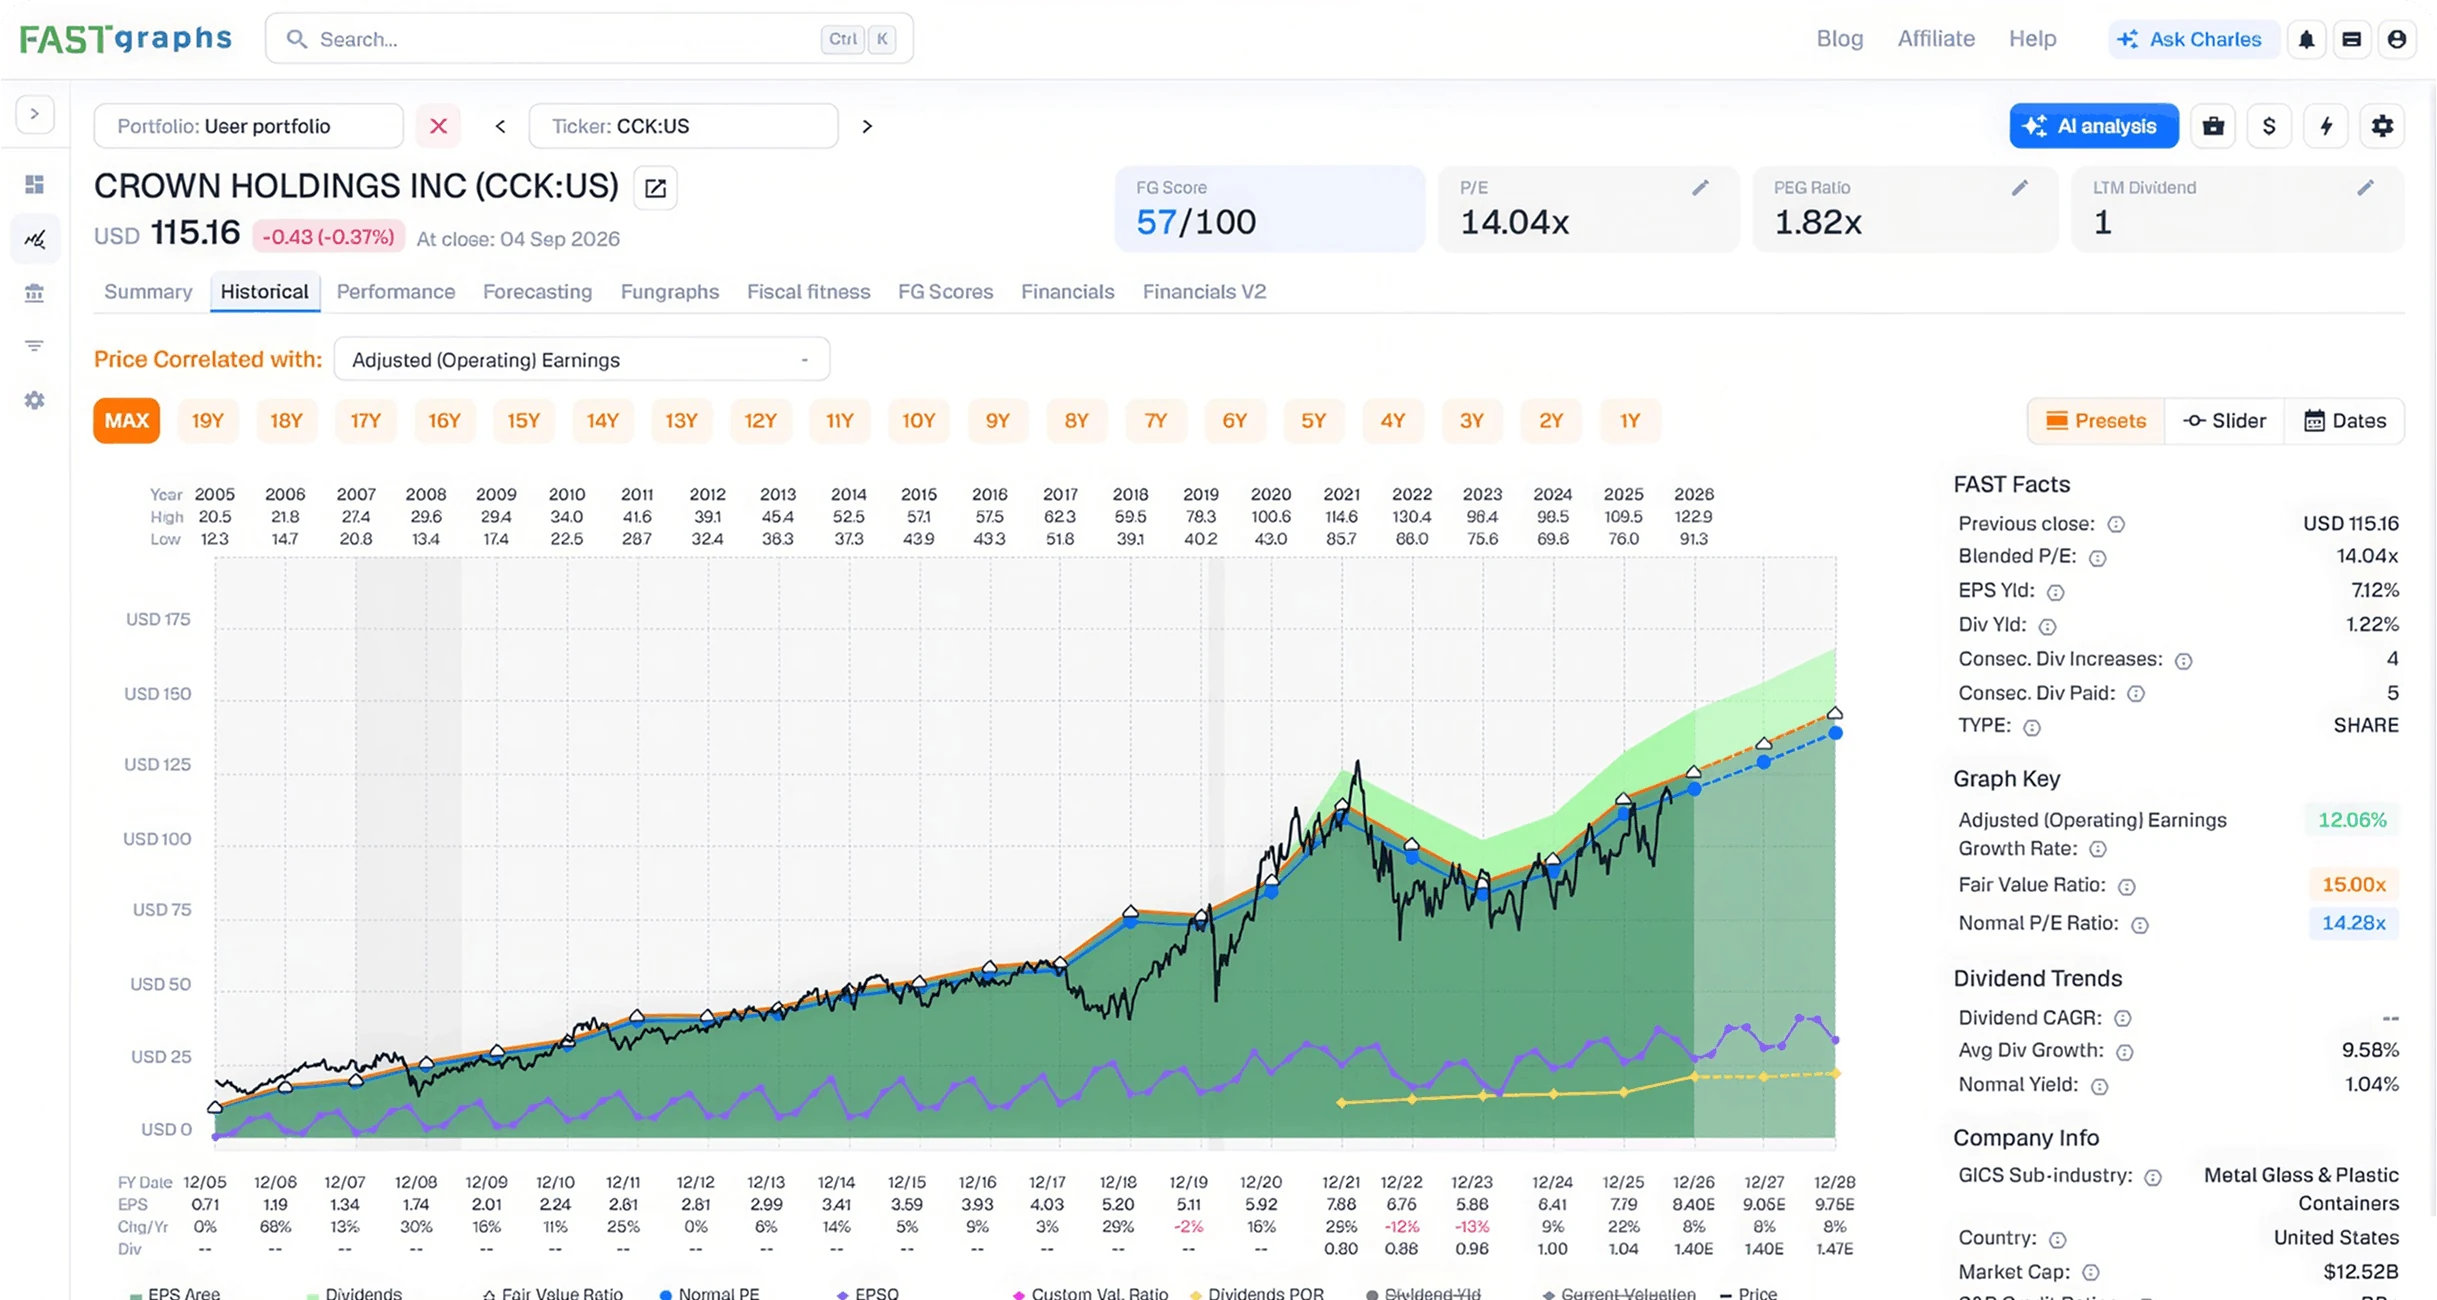
A FAST Graph of Crown Holdings from 2005 to 2028 estimates, showing the share price moving around the orange fair value line, with the FG Score, P/E and FAST Facts panels

How to read a FAST Graph

  1. The black line is the share price. It's what the market has been willing to pay.
  2. The orange line is fair value, worked out from the company's earnings. The lighter area on the right shows what analysts expect in the years ahead.
  3. The FG Score rates the quality of the business out of 100.
  4. FAST Facts sums up the valuation, yield and dividend record at a glance.

Shown: Crown Holdings (CCK), 2005 to 2028 estimates. For illustration only; not a recommendation.2

Chuck Carnevale

Created by Chuck Carnevale, who has spent more than five decades in the investment industry.

Built on premier, institutional-grade financial data.

We sell research tools, not investment advice. The decisions stay yours.

The idea behind FAST Graphs

In the 1970s, as a student at the University of Tampa, Chuck Carnevale came across an economics professor's thesis that stuck with him for the rest of his career:

“Earnings determine the market price of a publicly traded company in the long run.”

FAST Graphs started as a way to put that idea on a single chart: operating earnings on one line, the stock price on another. Over the years it grew to cover cash flow, dividends, sales and analyst forecasts. The purpose has stayed the same: make professional-grade financial analysis available to every investor, not just institutions and Wall Street insiders.

Chuck CarnevaleCo-founder and creator

Colton CarnevaleChief Operating Officer

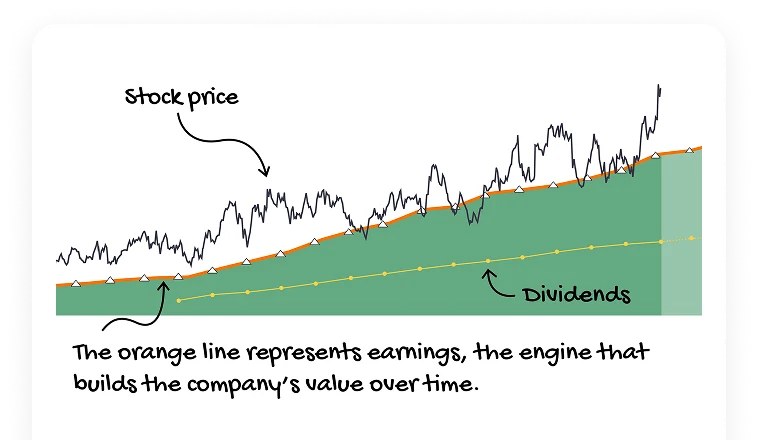
Hand-annotated chart: the stock price line, the orange earnings line that builds the company's value over time, and the dividends line
Earnings are the engine. Over time, the price tends to follow them.

“A stock is not just a ticker symbol or an electronic blip; it is an ownership interest in an actual business, with an underlying value that does not depend on its share price.”

Jason Zweig, summarizing Benjamin Graham's principles in The Intelligent Investor3

What's included

Everything you need to research a company, check its price and keep an eye on what you own.

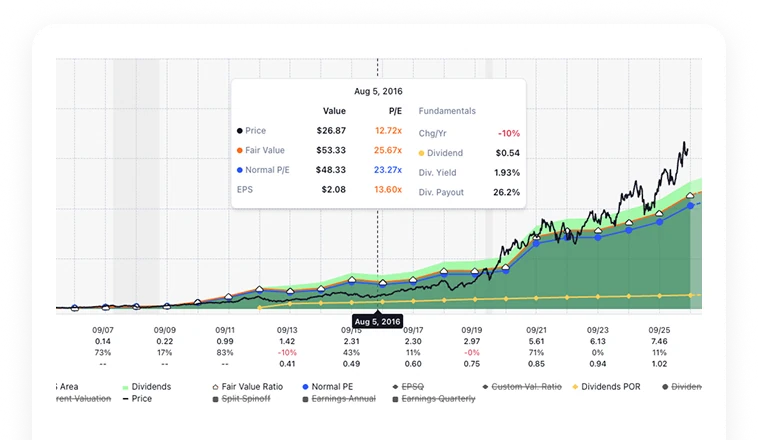
FAST Graphs chart with a tooltip showing price, fair value and normal P/E on a selected date

Years of history, plus what analysts expect

Look back as far as the data goes and forward to analyst estimates on the same chart. Hover over any date to compare the price, fair value and the stock's normal P/E. You'll quickly see whether optimism about the future is already in the price.

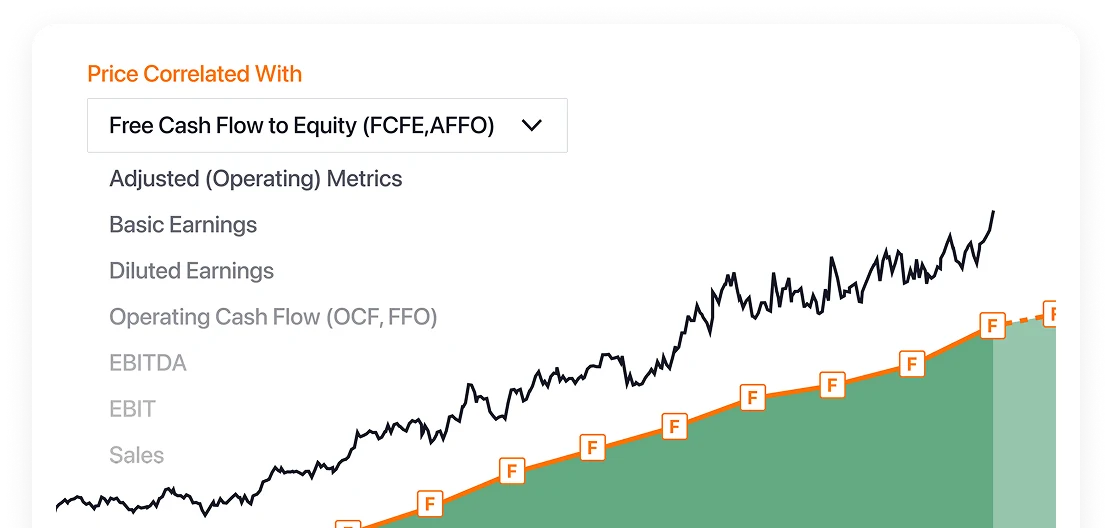
Menu for choosing which metric the price is compared with: adjusted earnings, basic and diluted earnings, operating cash flow, free cash flow to equity, EBITDA, EBIT and sales

Value each company on the measure that suits it

Earnings work for most businesses, but not all. Switch the chart to operating cash flow, free cash flow to equity, EBITDA, EBIT or sales. For REITs, use FFO or AFFO. You can also see how the market has rewarded or punished a company's results over time.

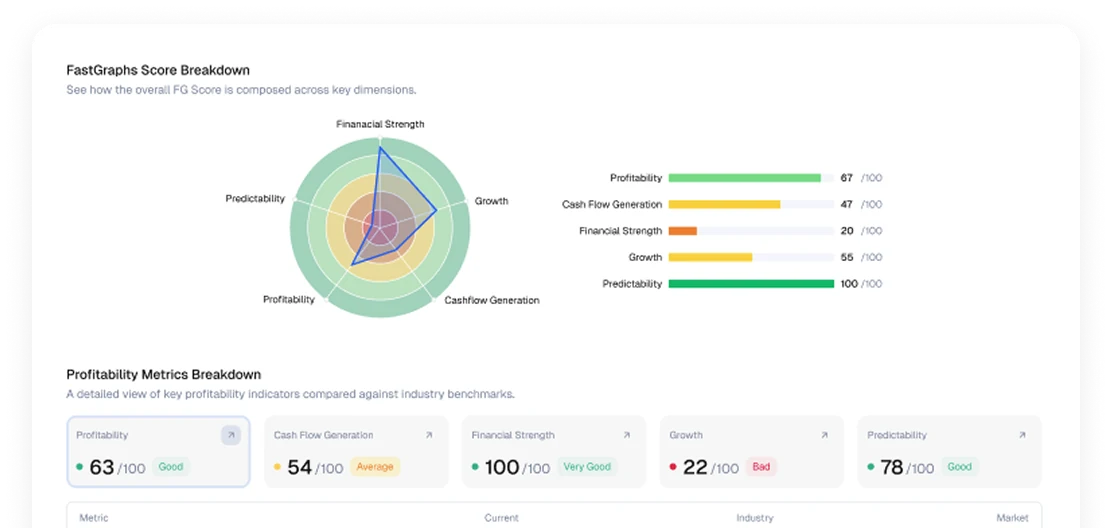
FG Score breakdown with a radar chart and scores for profitability, cash flow, financial strength, growth and predictability

A quality check before the price check

The FG Score sums up a company's fundamentals in one number. It covers profitability, cash flow, financial strength, growth and predictability, and you can compare the underlying metrics with the industry and the wider market. It's a quick way to judge the quality of a business before you look at its price.

Also included

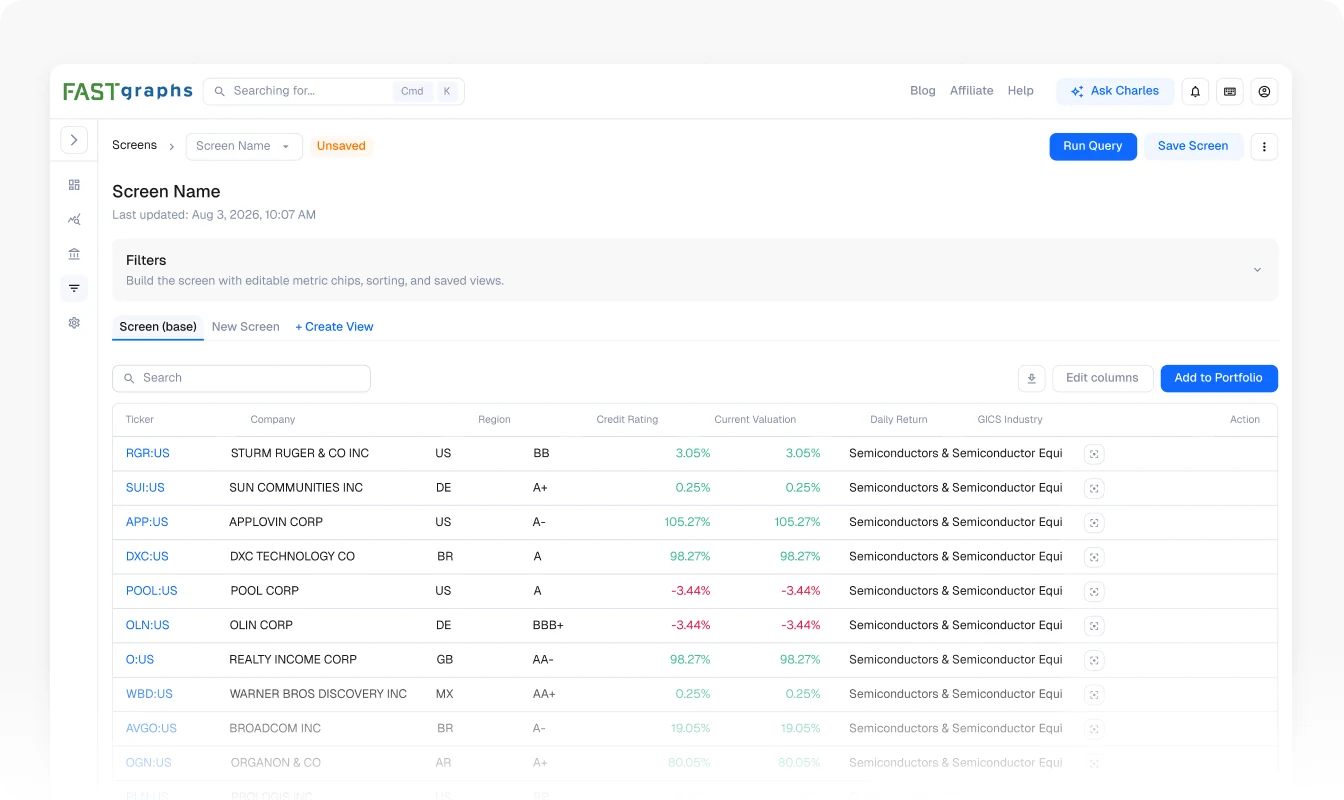
FAST Graphs stock screener results

Stock screener

Start from screens prepared by the FAST Graphs team, or build your own. For example, find companies trading below their own 5-year average P/E, or focus on companies whose analysts have a strong forecasting record.

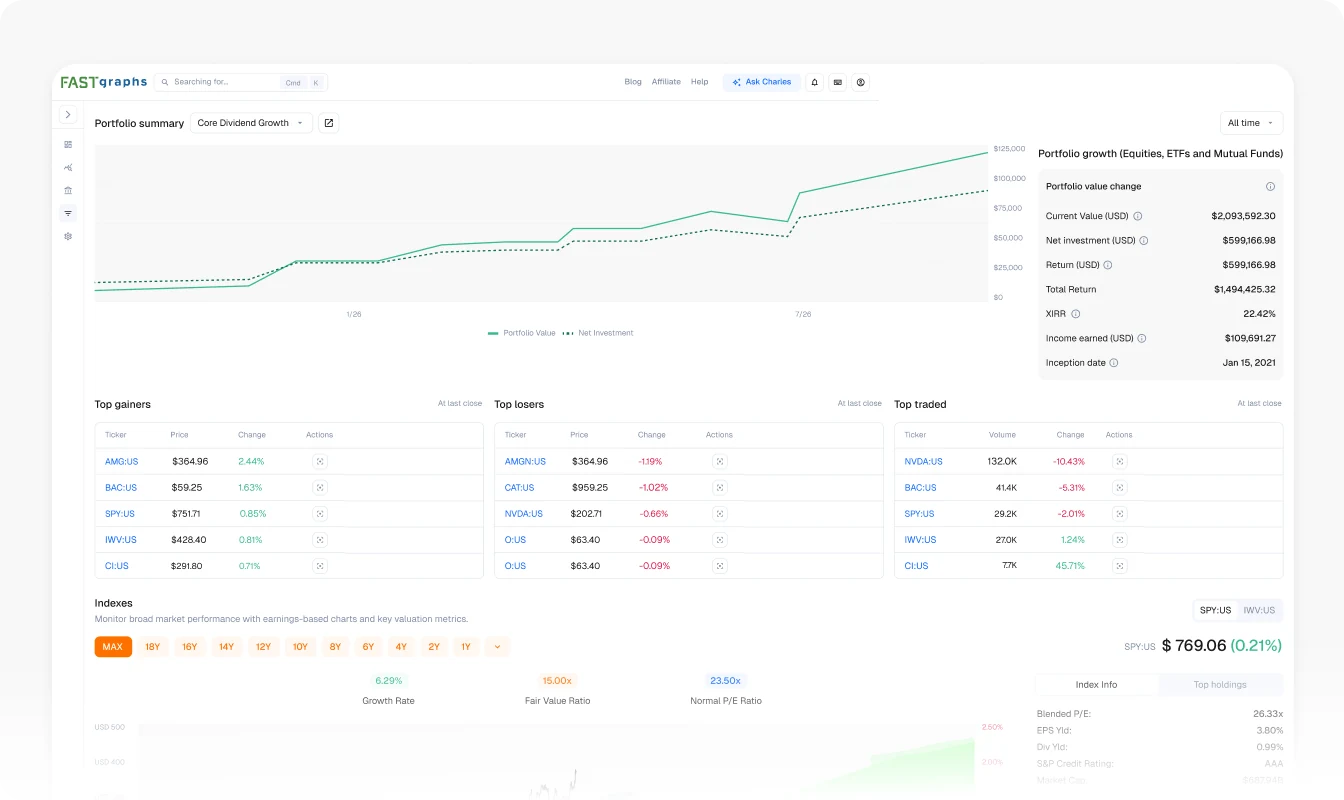
FAST Graphs portfolio summary with growth chart and top gainers and losers

Portfolio tracking

Connect your brokerage account or set up portfolios in FAST Graphs. Your buys, sells and cost basis show up on each company's chart, so you can see how your positions line up with value.

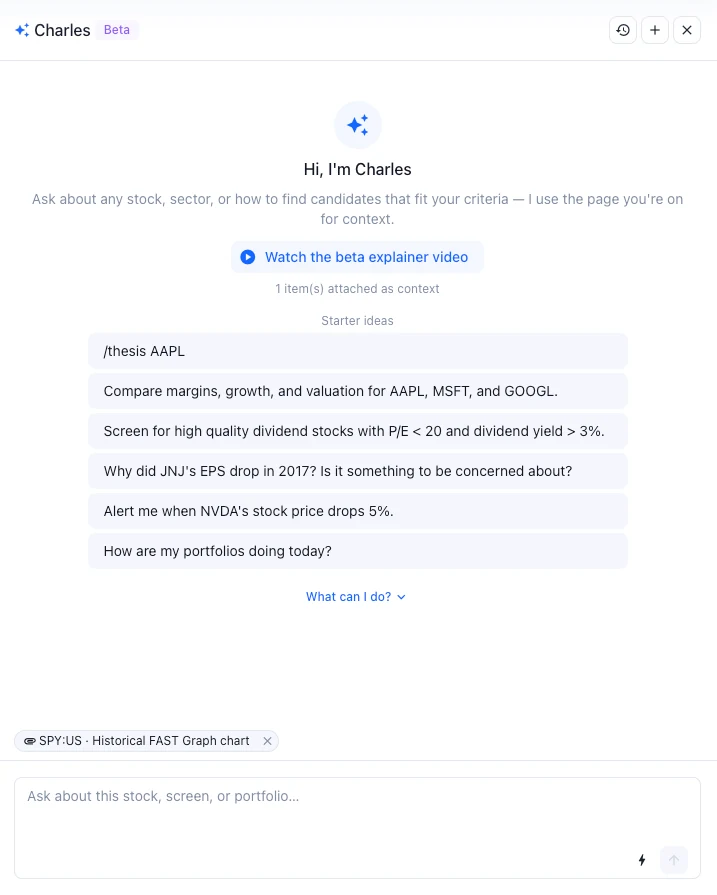
Charles, the research assistant in FAST Graphs, with example questions

Charles, your research assistant

Ask questions in plain English, such as “Why did JNJ's EPS drop in 2017?” or “How are my portfolios doing today?” Charles answers from the same data behind the charts. It can also build screens and compare up to 20 stocks at once.

What subscribers tell us

“Ever since I became a subscriber to Fast Graphs, it has helped me to become a better investor. I don't rely on Fast Graphs exclusively, but I consider it a 'core' tool that I use in my approach. I realize the general market environment has been pretty good for the last umpteen years, and that certainly helps. But, were it not for Fast Graphs, no doubt in my mind I would not have done nearly as well as I have.”
chicagotim1
“I have been a subscriber for some months. I want you to know FAST Graphs have become invaluable to me. I am an experienced chartist. FAST Graphs allow me to do fundamental analysis by looking at a chart. You have saved me from quite a few bad decisions. Thank you so much!”
Ray Branton
“Very satisfied user of F.A.S.T. Graphs here! I would like to point out to all those who are not retired investors, this strategy can (and in my opinion, should) be used as well as part of your investment arsenal. It is certainly a large portion of mine!”
Erik
“The longer I use and learn about FAST Graphs the more I appreciate them as an incredible investment tool.”
JPV
“Thanks for all the work you put into providing us with very understandable information (not to mention Fast Graphics ... my favorite tool).”
DJ

Individual subscribers' experiences. Results vary and are not guaranteed.4

Getting started

  1. 1

    Apply on WhatsApp

    Tap “Start free trial” and send the pre-filled message. We'll help you set up your free 7-day trial. No credit card is needed.

  2. 2

    Add what you own, or look for ideas

    Connect a brokerage account, set up a portfolio, or start from one of the prebuilt screens.

  3. 3

    Look up any company

    Check whether the price makes sense against earnings, review the business's quality, and decide for yourself.

Start my free trial (opens WhatsApp)

Watch “FAST Graphs New Version 6.0” on YouTube (opens in a new tab)

Prefer to watch first?

Take a tour of FAST Graphs 6.0 on our YouTube channel. You'll also find valuation examples and market commentary there.

Visit the FAST Graphs YouTube channel

Pricing

Try everything free for 7 days, then choose the plan that fits. You can change or cancel at any time.

Free trial

For new subscribers

$0 for 7 days

No credit card needed

Start free trial (opens WhatsApp)
  • Every Premium feature
  • Charles, the research assistant
  • 5 advanced portfolios
  • 5 broker connections
  • Unlimited screens

Basic

Earnings and cash-flow charts

$15.95 per month

Billed annually, saving $48 a year

Start free trial (opens WhatsApp)
  • Adjusted, basic and diluted earnings
  • OCF/FFO, FCFE and AFFO
  • 3 basic portfolios

Payments are processed securely by Stripe. Visa, Mastercard, American Express, Discover, Apple Pay and Google Pay accepted.5

Common questions

Do I need a credit card to start?

No. You can create an account without one. New subscribers get 7 days of full Premium access when they choose a plan.

I'm not a numbers person. Is this for me?

Yes. The whole point of FAST Graphs is that you can read a company's valuation from a picture. If the price is well above the orange line, it may be expensive. If it's below, it may be good value. You can go deeper whenever you're ready, and Charles can explain any metric in plain English.

What happens if I cancel?

You can cancel at any time. You keep full access until the end of your current billing period.

Can I change plans later?

Yes. Upgrades take effect right away, and any unused time is credited toward the new plan. Downgrades take effect at the end of your billing period. If you switch from monthly to annual billing, your remaining monthly balance is applied at checkout.

Do you give stock tips or investment advice?

No. FAST Graphs provides data, charts and research tools. What you buy or sell is always your decision.

Is it only for retirees and dividend investors?

No. FAST Graphs is built for rational, long-term investors of any age. As one subscriber put it, investors who aren't retired can and should use the approach too.

Have another question? Get in touch with our team.

Invest intelligently, not emotionally.

Look up a company you own, or one you've been thinking about buying. See where the price sits against its earnings. It's the simplest way to find out whether FAST Graphs is right for you.

Start your free 7-day trial (opens WhatsApp)

Opens WhatsApp. No credit card needed. Cancel anytime.1

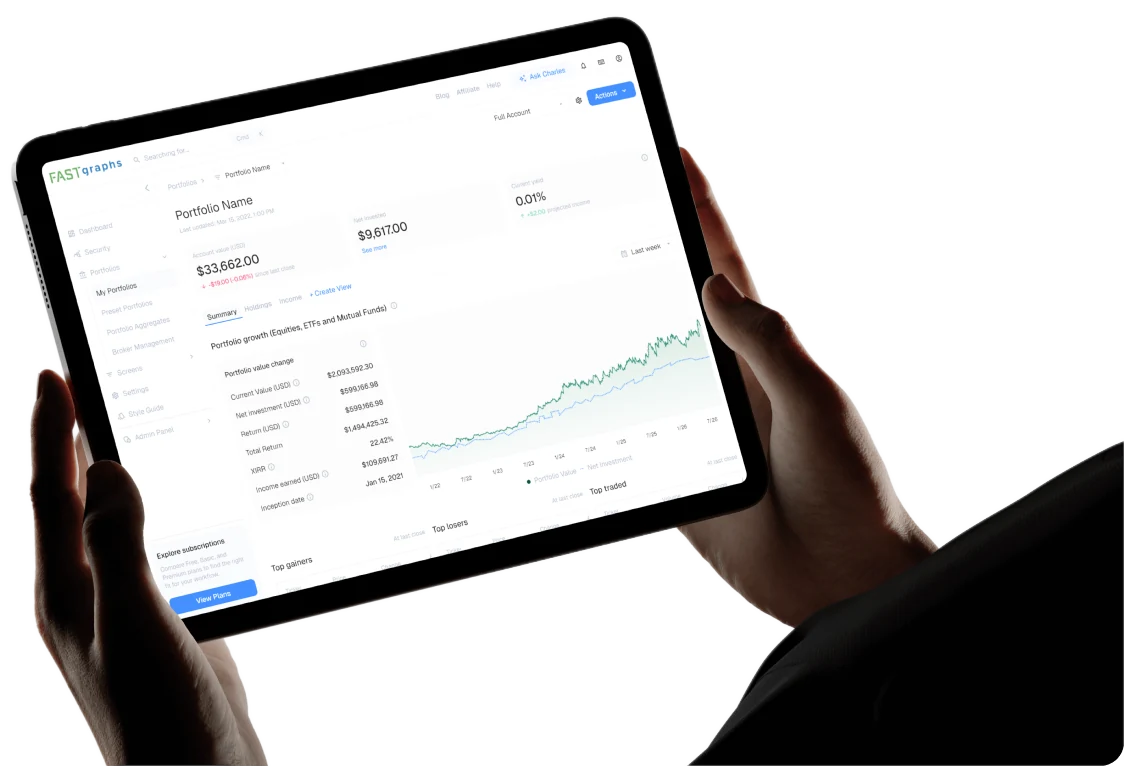
FAST Graphs portfolio page on a tablet

Important information

  1. The 7-day free trial is available to new FAST Graphs subscribers, and no credit card is needed to sign up. Trial requests are handled on WhatsApp: the “Start free trial” buttons open a chat with +1 (213) 527-5337 and a pre-filled message.
  2. Crown Holdings (CCK) is shown as it appeared in FAST Graphs at the close on September 4, 2026, for illustration only. It is not a recommendation to buy or sell any security. Fair value is an analytical estimate based on a company's earnings (or another metric you select) and a valuation multiple; it is not a price target. Figures for future years are analyst estimates and may not be achieved.
  3. From Jason Zweig's introduction to the revised edition of Benjamin Graham's The Intelligent Investor.
  4. Testimonials are from FAST Graphs subscribers and are reproduced as published on fastgraphs.com. They reflect individual experiences, may not be representative of other subscribers, and are no guarantee of future performance or success.
  5. Prices are shown per month, billed annually. Premium is offered at $18 per month ($216 billed annually), 55% below its regular price of $40 per month; the price confirmed when you subscribe applies. Basic savings are as stated on fastgraphs.com/pricing. Sales tax may apply depending on your location. You can cancel at any time and keep access until the end of your current billing period. Upgrades take effect immediately, with unused time credited; downgrades take effect at the end of the billing period.

All investing involves risk, including the possible loss of principal. Past performance is no guarantee of future results. FAST Graphs provides financial data and analysis tools for information and education only and does not provide investment, tax or legal advice. Nothing on this page is a recommendation to buy or sell any security.